Research Project- Rob Clouth

Rob Clouth is an electronic musician, sound designer, and new media artist based in Barcelona. Clouth makes a mix between techno music and IDM (intelligent dance music).

He uses various forms of programming to create his music. He uses sound painting, which means he sculpts sounds by painting their spectrums using a digitizer. I think this is cool, because it’s almost like reverse sound-making, because usually a sound is represented by a sound spectrum, rather than the spectrum being created first.

Clouth also carries around different microphones, just in case he hears a sound he wants to use in his music. He uses deep-ear binaural mics, waterproofed contact mics (I guess for recording sounds underwater), and a coil mic that picks up electromagnetic fields of electronic devices. I think it’s cool how he carries microphones around, similar to how a photographer carries a camera and lenses.

The video above is a piece form Clouth called ‘Islands of Glass’. I personally love how the visuals interact with what is going on in his music. I’m not sure how the visuals were made for this video, but Clouth has recently created another piece called ‘Transition’, which is shown in the video below. In this piece, Couth generates the audio with an algorithm that he wrote to scan through his music collection in date-order. The algorithm takes little slices of audio from each track and stitches them together to form one continuous mix. I like this piece, because the visuals were inspired by the growth rings on trees. Clouth loves how trees encode their own history with these rings, as well as the history of its surroundings.

I love how Rob Clouth combines audio and visuals so well. All of his videos are mesmerizing, and the audio is very unique. You can check out some of his other pieces on his website:

http://www.robclouth.com/#home


Research Project — Daniel Rozin

Daniel Rozin is an Israeli-American artist based in New York. He studied industrial design at the Bezalei Academy of Art and Design in Jerusalem, before entering the Interactive Telecommunications Program at NYU 10 years later. In this program, Rozin learned how to be creative with technology by means of programming and electronics. From technology, Rozin found the creativity to be an artist and he now works in the field of interactive digital art.

Rozin’s work is primarily composed of installations and sculptures that respond to the presence of a viewer. He uses various mediums to create art, from pure software to electronics to static and kinetic sculpture. Oftentimes, the viewer becomes the contents of the piece, as Rozin explained in an interview with Leaders in Software and Art, “The artist creates the premise and the parameters of interaction, the artist’s responsibility is to imagine almost all possible interactions and see that those would yield an acceptable result. It is important for the interactive artist to leave a big chunk of the piece open to interactivity so that the viewer can really change the piece and feel ownership over it.”

The piece above is from Rozin’s “Mechanical Mirrors” series. In this particular piece, he explores the intersection of soft materials and mechanics, but the series uses various materials to act as the mirrors. According to Co.Design, Rozin creates these mirrors by using custom-built software written in C++ that translates data from a camera into simplified pixels, which play across the face of his sculptures in near real time. Interestingly, none of the technology he uses in this series is in the viewer’s line of sight.

I especially like this series, because I think it playfully accomplishes Rozin’s mission of closing the gap between technology and humans, as he said in an interview, “Nowadays we are exposed to a lot of technological wizardry and don’t think twice about it, in fact we have given up on trying to understand it…I try to make technological devices that are simple to understand and rely on our intuition rather than defy it.”

In other works, Rozin continues to explore mirror concepts, since he stated in numerous interviews that his main interest in his art is to explore the way we view the world and create images in our mind; mirrors seem to exemplify this concept.

His website

His Vimeo

Working with Data

Hello everyone,

I hope this post finds you well.

For my assignment on data, I decided to look for my own API and my experience was both rewarding and stressful to say the least. To begin I wanted to say that there are certain APIs online that should be avoided to recoded because of lacking documentation. I decided to work with the following API:

https://whatdoestrumpthink.com/api-docs/index.html

Prior to working with this, I tried using Instagram’s API for generating a random image but I felt that it had been done countless times. For my project, I used the API that I found to generate a Donald Trump in a somewhat random manner. Every time the user clicks the mouse, a new trump quote will appear. I wanted to work with the GIPHY API as well and some of the comments may reflect that but I had some trouble making two APIs work. My final goal is to be able to generate a random Trump Gif with a random Trump quote just for the sake of banter. As soon as I get both to work, I will update my sketch.

Thank you for your time and see you all on Friday!

-Cesar

My Sketch:

Data Sketch – Shyam Mehta

This project allowed me to think about how I could incorporate my own interests into the code. However, I had trouble working with p5.js on my computer. I understand how the code needs to be written, but was unsure if my API was working or not. I tried multiple API’s yet there was no change. When I settled on the Bitcoin API, I tried multiple approaches but still couldn’t figure out how to get the code to print.  I still felt like this project was interesting and hope I can figure out what was wrong after today’s class.

Data

I think one of the hardest parts of this assignment was getting access to the APIs; either I didn’t have a key, or there was some linkage problems going on in within my sketch. For example, sometimes when I linked an API, my sketch would be stuck on “Loading…”. Because I had to cycle through a lot of different APIs, I had to come up with different ideas of sketches, but I finally settled on getting an API from google books. I wanted it so that the title of the books linked would appear. Their font size would be determined by how many pages they have, and their font color would be determined by their average ratings. However, I am having problems with creating functions and linking it to the API, and so none of my elements in the draw function work.

Research Project- BlokDust


https://blokdust.com/

I’m always interested in the projects that combine the visual and audio effects together and give the audience a complete experience with different senses. And then I found BlokDust.

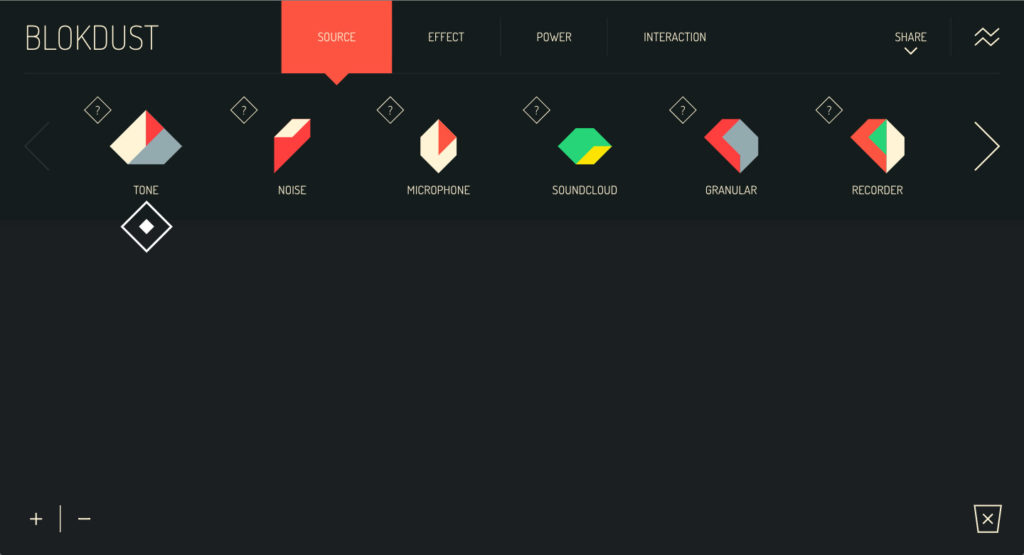
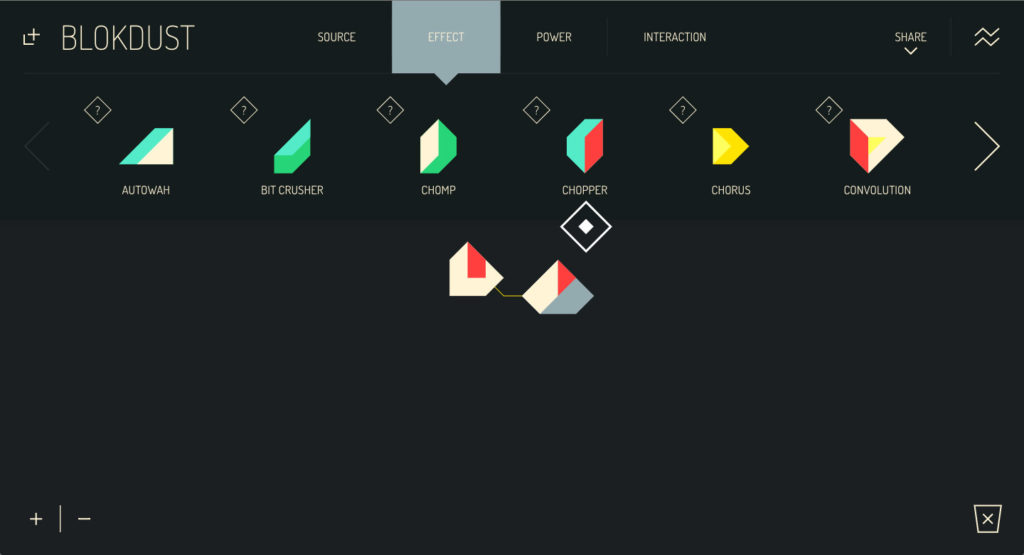
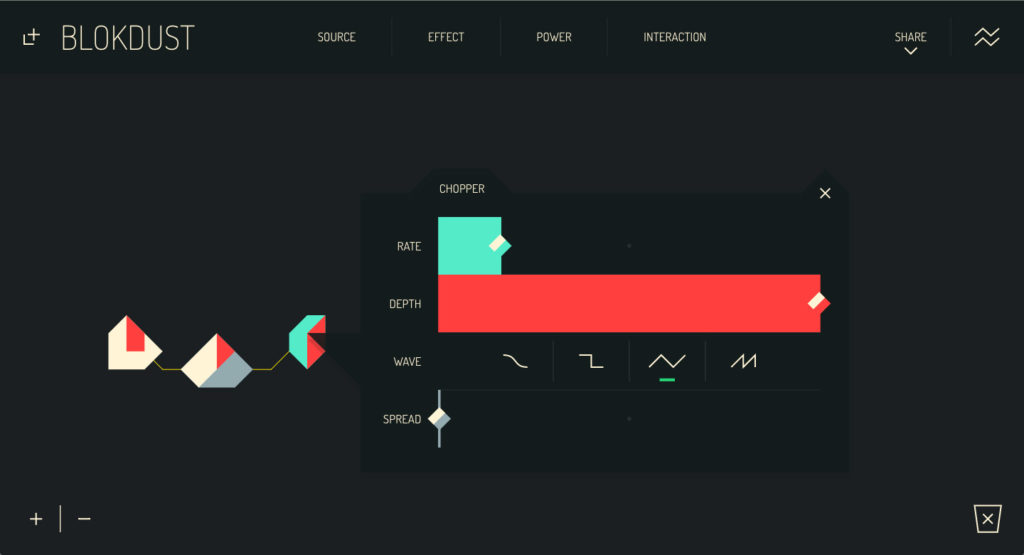
BlokDust is a web-based music making app. Users can build synthesizers, put effects on the voice, remix and manipulate samples and arrange self-playing music environment by connecting the blocks together.

BlokDust is created by Luke Twyman, Luke Philips, and Edward Silverton. Developed in Brighton UK and released in 2016.

The web itself is well designed. I really like the interface. It’s pretty clean and has a clear guide to help the users to get started. It does improve the experience of making music and give the users a better visualization of it.

Instead of just using play and stop, Blokdusk creates some new ways to play the music with the block interacted with each other.

Examples:

Playing with the keyboard:

https://blokdust.com/?c=N1V7mjxqW&t=Cello%20Sampler

self-playing:

https://blokdust.com/?c=VkF2_je5W&t=Rotational%20Sequencer

More about BlokDust:

https://guide.blokdust.com/

BlokDust uses the Web Audio API and make use of Tone.js as an audio framework. Here is the Github link:

https://github.com/BlokDust/BlokDust


Data

This assignment gave me a lot of trouble, and caused me a lot of confusion. Searching for different APIs that I wanted to use was fun, but trying to get the API keys were a pain. I kept having to throw out ideas simply because I couldn’t get an API key. I’ve signed up for countless websites, but for some reason I haven’t been getting any data.

I found a really cool API that has data of random facts for every number. My idea was that the user could type in a number and a random fact about that number would pop up. I would have it refresh whenever the user presses a button. I still can’t seem to get the API to work, which is frustrating. I’ve watched all of the videos on using API’s, but this is still confusing to me.

Data post

For the data sketch, I found an API from the GitHub list that listed threats to the Atlantic Puffin. There was a lot of information in there that I could use, but I really just wanted to represent the threats to the puffin in a visual way. So the information I used was the “name” of the animal and the “title” of each one of the threats. Other data included timing, scope, severity, among others, which were mostly classified as “Unknown,” which I didn’t think would fit in my sketch. I counted 17 threats listed in the API, but I only chose 9 that I thought could be represented in an aesthetically pleasing manner. Also, some threats were ambiguous and couldn’t be incorporated into the sketch, such as “Other impacts”, and “Type Unknown/Unrecorded.” In the end, I created visuals for the puffin and 9 of its threats. I placed the puffin on the left and pulled the name from the API and placed it right under. On the right side, I created 3 sets of ellipses, each of which would randomly changed into 1 of 3 different threats every time the sketch is reloaded, for a total of 9 threats.

Openprocessing link:

API Link:

http://apiv3.iucnredlist.org/api/v3/threats/species/name/Fratercula%20arctica/region/europe?token=9bb4facb6d23f48efbf424bb05c0c1ef1cf6f468393bc745d42179ac4aca5fee

p5.js Data

My sketch is based on Studio Ghibli API, which is one of the public APIs from the github page. I also looked into few other APIs under the topic of games (Rick and Morty and Amiibos), but I had difficulty loading the JSON from these APIs. At first I thought this was because different APIs need different call functions(?). The descriptions of the APIs talked about GET HTTP or REST calls and etc. that I couldn’t quite understand. All of the APIs that I was interested in did not load at first, so I found httpGet() from p5.js reference page and used this example to successfully load the Ghibli API (other datas did not work with this), although I don’t understand the syntax.

My sketch isn’t anything cool with animated shapes, but it pulls title, description and rt_score from the data and allows the user to look through different Ghibli films with a mouse click (it would have been nice if the data included image urls as well).

Ghibli Sketch

Today, after Alex’s slack message, I tried using console.log() instead of prinln() and Rick and Morty data started to work. However, now I am faced with another problem of not being able to load the image from this data. If I preload a specific image url from the data it works, but I cannot figure out how to load the image after loading the data.

Rick and Morty sketch attempt

Data, not Data

This was definitely one of the tougher assignments me for me especially because I couldn’t make it to class on Friday. So I watched the video series the professor posted and read some documentation and got to work looking for an API that had  a lot of data and was based on something that was practical to display visually. I got access to an API that contained basic data from all the worlds countries like, name, population, rank, and percent global contribution.  Below is the link to my sketch.

https://www.openprocessing.org/sketch/529279